In this blog post, we give a brief overview of which problem INODE solves, which approaches INODE uses and highlight the major challenges. We also provide links for further reading.
1 Which Problem does INODE Solve?
Enterprises and scientific organizations often keep vast amounts of data in large databases. Accessing these databases requires deep knowledge in database query languages such as SQL. However, end-users who do not have sufficient technical know-how, are basically excluded from querying these information sources effectively.
The goal of INODE is to enable people to explore different types of data through natural language as well as visualizations. On the one hand, INODE empowers users to interact with data stored in databases as well as in text documents similar to a dialog with a human. On the other hand, INODE proactively guides the user during data exploration and visually explains complex patterns in data.
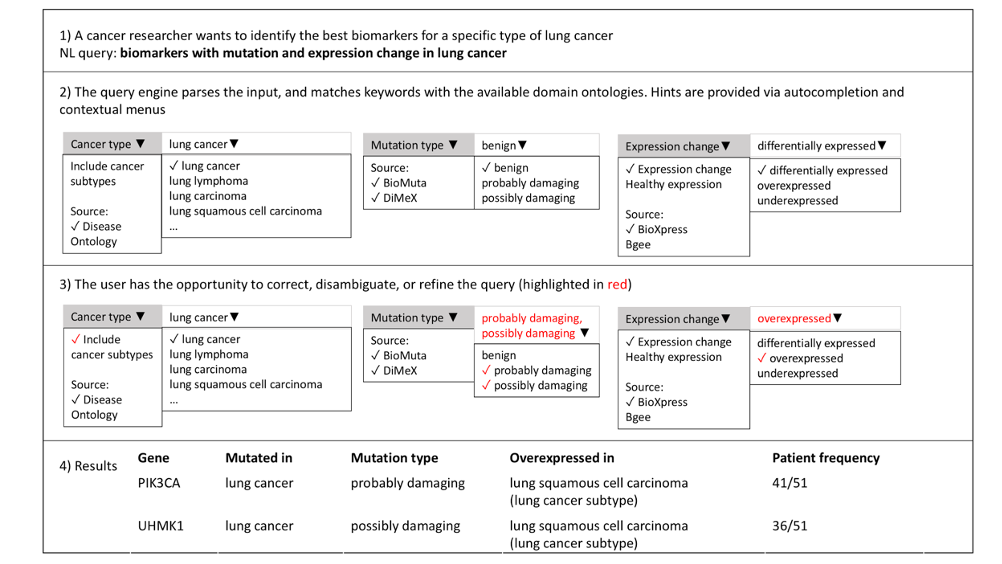
Assume that you are a scientist who wants to study lung cancer. Further assume that you want to find out which specific biomarkers are indicators for a certain type of lung cancer. How would you tackle this problem?
One approach would be to sit down and read about what other researchers have published. This is a feasible approach but it might take quite a while to find the relevant information. Another approach would be to query the latest bioinformatics databases that contain curated information. However, these databases are typically very complex and you might not have enough technical knowledge to query these databases effectively. A better solution might be to have a tool or service that assists you in exploring the data and that guides you in the right direction.
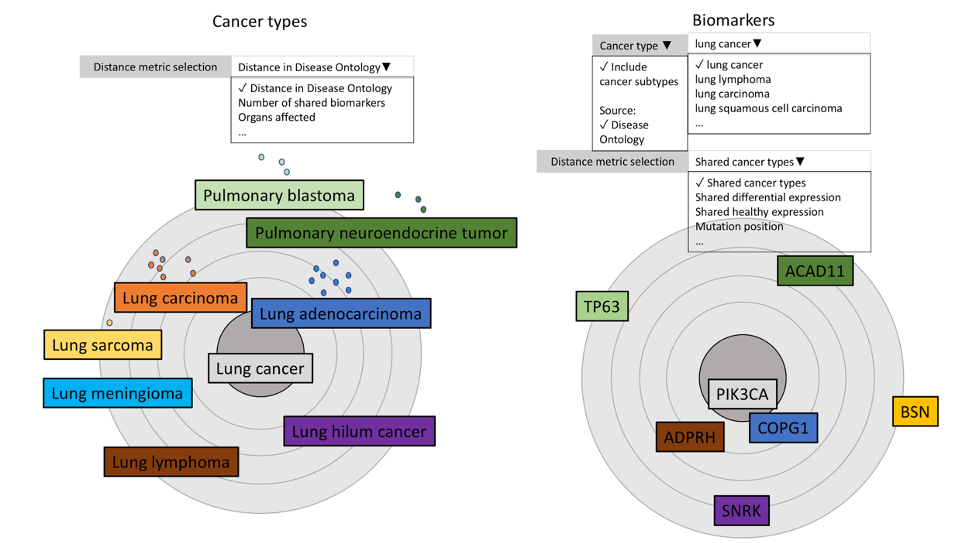
The following figures demonstrate INODE’s vision of intelligent data exploration to tackle the above-mentioned use case. Figure 1 shows a natural language query with user assistance. INODE parses the query, provides hints for autocompletion and disambiguates terms. After the user has explored data in natural language, she can visually analyze the results. Figure 2 clusters cancer types retrieved by the natural language query. The user can explicitly choose, for instance, the distance metric for the cancer types and which biomarker to further explore.


2 Which Approaches does INODE Use?
INODE uses different types of technology for data exploration:
3 What are the Main Challenges?
Traditionally, the database community tackled problems related to analyzing structured data with SQL or SPARQL as the major query languages. On the other hand, the information retrieval or natural language processing communities tackled problems related to unstructured, text data with keyword search or natural language interfaces to data. INODE will break down these barriers between the communities and build services that enable exploring both structured and unstructured data in natural language. However, because natural language is ambiguous, it is hard for a machine to be able to understand the intended meaning of the users. Hence, we will build novel services that enable combining natural language queries with visual exploration. The major challenge here is how to design visual interfaces that enable exploring large amounts of information (typically in the form of knowledge graphs) without overloading the users with too many details that distract from identifying the core insights.
References
Affolter, K., Stockinger, K., & Bernstein, A. (2019). A comparative survey of recent natural language interfaces for databases. The VLDB Journal, 28(5), 793-819.
Blunschi, L., Jossen, C., Kossmann, D., Mori, M., & Stockinger, K. (2012). Soda: Generating sql for business users. Proceedings of the VLDB Endowment, 5(10), 932-943.
Calvanese, D., Cogrel, B., Komla-Ebri, S., Kontchakov, R., Lanti, D., Rezk, M., … & Xiao, G. (2017). Ontop: Answering SPARQL queries over relational databases. Semantic Web, 8(3), 471-487.
Kokkalis, A., Vagenas, P., Zervakis, A., Simitsis, A., Koutrika, G., & Ioannidis, Y. (2012). Logos: a system for translating queries into narratives. In Proceedings of the 2012 ACM SIGMOD International Conference on Management of Data (pp. 673-676).
May, T., Steiger, M., Davey, J., & Kohlhammer, J. (2012, June). Using signposts for navigation in large graphs. In Computer Graphics Forum (Vol. 31, No. 3pt2, pp. 985-994). Oxford, UK: Blackwell Publishing Ltd.
Omidvar-Tehrani, B., Amer-Yahia, S., & Lakshmanan, L. V. (2018). Cohort representation and exploration. In 2018 IEEE 5th International Conference on Data Science and Advanced Analytics (DSAA) (pp. 169-178). IEEE.
Papadakis, N., Litke, A., Doulamis, A., Protopapadakis, E., & Doulamis, N. (2019). Multimedia Analysis on User-Generated Content for Safety-Oriented Applications. In Social Media Strategy in Policing (pp. 161-175). Springer, Cham.
Sima, A. C., Mendes de Farias, T., Zbinden, E., Anisimova, M., Gil, M., Stockinger, H., … & Dessimoz, C. (2019). Enabling semantic queries across federated bioinformatics databases. Database, 2019.
Stockinger, K. The Rise of Natural Language Interfaces to Databases. SIGMOD Blog, June 2019, https://wp.sigmod.org/?p=2897